UK House Price Index summary: March 2023
Published 24 May 2023

漏 Crown copyright 2023
This publication is licensed under the terms of the Open Government Licence v3.0 except where otherwise stated. To view this licence, visit or write to the Information Policy Team, The National Archives, Kew, London TW9 4DU, or email: psi@nationalarchives.gov.uk.
Where we have identified any third party copyright information you will need to obtain permission from the copyright holders concerned.
This publication is available at /government/statistics/uk-house-price-index-for-march-2023/uk-house-price-index-summary-march-2023
1. Headline statistics for March 2023
The average price of a property in the UK was 拢285,009
The annual price change for a property in the UK was 4.1%
The monthly price change for a property in the UK was -1.2%
The monthly index figure (January 2015 = 100) for the UK was 149.5
Estimates for the most recent months are provisional and are likely to be updated as more data is incorporated into the index. Read Revisions to the UK HPI data.
Next publication of UK HPI
The April 2023 UK HPI will be published at 9.30am on Wednesday 21 June 2023. See the calendar of release dates for more information.
2. Economic statement
The annual percentage change for average UK house prices was 4.1% in the 12 months to March 2023, compared with 5.8% in the 12 months to February 2023.
The average UK house price was 拢285,000 in March 2023, which is 拢11,000 higher than 12 months ago, but 拢8,000 below the recent peak in November 2022. Average house prices increased over the 12 months to 拢304,000 (4.1%) in England, to 拢214,000 in Wales (4.8%), to 拢185,000 in Scotland (3.0%) and to 拢172,000 in Northern Ireland (5.0%).
On a non-seasonally adjusted basis, average UK house prices decreased by 1.2% between February 2023 and March 2023, while average UK house prices increased by 0.5% during the same period 12 months ago.
Annual house price inflation was highest in the South West where prices increased by 5.4% in the 12 months to March 2023. London was the English region with the lowest annual growth, where prices increased by 1.5% in the 12 months to March 2023.
The Royal Institution of Chartered Surveyors鈥� (RICS鈥�) reported a fall in demand. When disaggregated, the downturn in buyer demand remains widespread across the UK, with virtually all regions/countries posting a negative reading in the latest returns
The reported a modest pick-up in secondary market activity and requests for valuations, but said that demand was broadly equal to the supply of properties available.
The UK Property Transactions Statistics showed that in March 2023, on a seasonally adjusted basis, the estimated number of transactions of residential properties with a value of 拢40,000 or greater was 89,560. This is 18.9% lower than 12 months ago (March 2022). Between February 2023 and March 2023, UK transactions increased by 1.3% on a seasonally adjusted basis.
The release reported that mortgage approvals for house purchases, an indicator of future borrowing, significantly increased to 52,000 in March 2023, from 44,100 in February 2023, yet remains below the monthly average for 2022 of 62,700.
3. Price changes
3.1 Annual price change
Annual price change for UK by country over the past 5 years

(CSV, 1KB)
Average house prices in the UK increased by 4.1% in the 12 months to March 2023, down from 5.8% in February 2023.
At the country level, the highest annual house price percentage change in the 12 months to March 2023 was recorded in Wales, where house prices increased by 4.8%.
England saw house prices increase by 4.1% in the 12 months to March 2023.
Scotland saw houses prices increase by 3.0% in the 12 months to March 2023.
Northern Ireland saw house prices increase by 5.0% over the 12 months to Quarter 1 (January to March) 2023.
3.2 Average price by country and government office region
Price, monthly change and annual change by country and government office region
| Country and government office region | Price | Monthly change | Annual change |
|---|---|---|---|
| England | 拢304,193 | -1.5% | 4.1% |
| Northern Ireland (Quarter 1 - 2023) | 拢172,005 | -1.8% | 5.0% |
| Scotland | 拢184,877 | 0.7% | 3.0% |
| Wales | 拢214,174 | -0.6% | 4.8% |
| East Midlands | 拢246,092 | -1.2% | 4.9% |
| East of England | 拢351,898 | -2.0% | 3.9% |
| London | 拢523,325 | -1.7% | 1.5% |
| North East | 拢156,912 | -1.6% | 4.0% |
| North West | 拢211,759 | -1.3% | 5.2% |
| South East | 拢394,543 | -0.4% | 4.6% |
| South West | 拢326,035 | -0.6% | 5.4% |
| West Midlands Region | 拢245,132 | -4.0% | 3.4% |
| Yorkshire and The Humber | 拢203,635 | -2.1% | 4.1% |
(CSV, 1KB)
Price changes by country and government office region
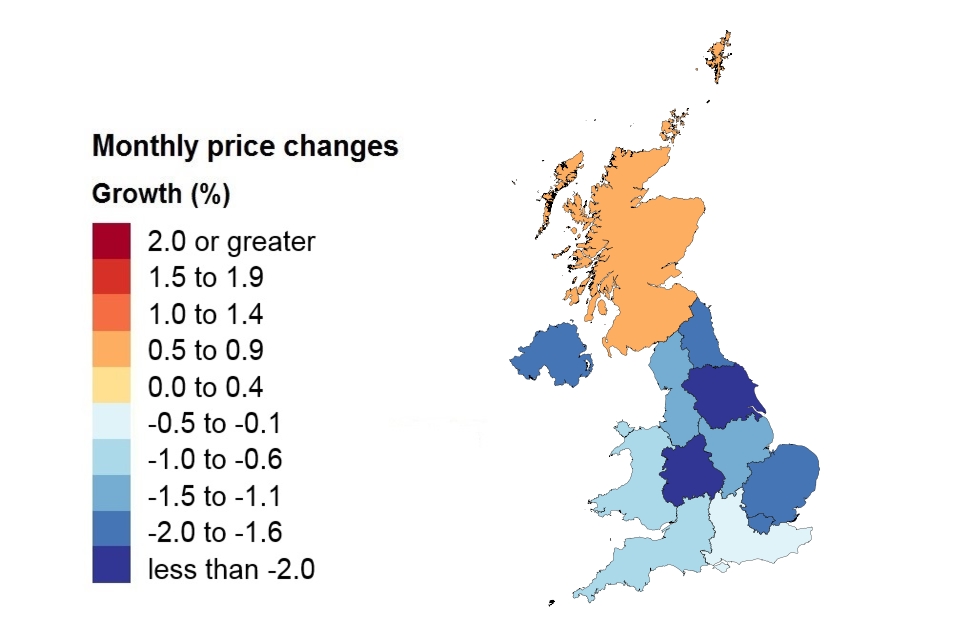
On a non-seasonally adjusted basis, average house prices in the UK decreased by 1.2% between February 2023 and March 2023. This was down from an increase of 0.5% during the same period 12 months ago (February 2022 and March 2022). On a seasonally adjusted basis, average house prices in the UK decreased by 0.9% between February 2023 and March 2023.
Note: The Northern Ireland figure represents a 3-month change and is not comparable with the other regions and countries.
3.3 Average price by property type
Average monthly price by property type
| Property type | March 2023 | March 2022 | Difference |
|---|---|---|---|
| Detached | 拢453,949 | 拢431,184 | 5.3% |
| Semi-detached | 拢277,291 | 拢264,692 | 4.8% |
| Terraced | 拢229,752 | 拢223,048 | 3.0% |
| Flat or maisonette | 拢227,925 | 拢221,211 | 3.0% |
| All | 拢285,009 | 拢273,787 | 4.1% |
(CSV, 1KB)
4. Sales volumes
The amount of time between the sale of a property and the registration of this information varies. It typically ranges between 2 weeks and 2 months but can be longer. Volume figures for the most recent 2 months are not yet at a reliable level for reporting, so they are not included in the report. Published transactions for recent months will increase as later registered transactions are incorporated into the index.
Sales volume data is also available by property status (new build and existing property) and funding status (cash and mortgage) in our downloadable data tables. Transactions involving the creation of a new register, such as new builds, are more complex and require more time to process. Read Revisions to the UK HPI data for more information.
4.1 Sales volumes
Number of sales volumes by country
Comparing the provisional volume estimate for the current month with the revised volume estimate for the corresponding month in the previous year
| Country | January 2023 | January 2022 |
|---|---|---|
| England | 36,038 | 51,592 |
| Northern Ireland | 1,427 | 1,953 |
| Scotland | 5,791 | 7,326 |
| Wales | 2,001 | 2,969 |
Note: Comparing the provisional volume estimate for the current month with the revised 12-month volume estimate.
(CSV, 1KB)
Note: The 鈥楧ifference鈥� column has been removed from this table as the latest month鈥檚 data are not yet complete.
Note: The number of property transactions for January 2023 will increase as more transactions are incorporated into the index. See our Revisions Policy for more information.
Comparing the provisional volume estimate for January 20222 with the provisional estimate for January 2023, volume transactions increased by 17.8% in England, decreased by 19.4% in Scotland and increased by 9.9% in Wales. Northern Ireland鈥檚 volume transactions decreased by 21.3% in the year to Quarter 1 2023.
UK Property Transaction Statistics聽published by HM Revenue & Customs (which differ in coverage but are more complete for this period) report that on a non-seasonally adjusted basis, in the 12 months to January 2023 volume transactions decreased by 7.8% in England, decreased by 17.0% in Wales, decreased by 19.2% in Scotland, and decreased by 22.7% in Northern Ireland.
4.2 Sales volumes for the UK over the past 5 years
Sales volumes for 2019 to 2023 by country: January

(CSV, 1KB)
Note: The number of property transactions for January 2023 will increase as more transactions are incorporated into the index. See our Revisions Policy for more information.
Comparing the provisional volume estimate for January 20222 with the provisional estimate for January 2023, UK volume transactions increased by 9.3%.
UK Property Transaction Statistics published by HM Revenue & Customs (which differ in coverage but are more complete for this period) report that on a non-seasonally adjusted basis, UK volume transactions decreased by 9.6% in the 12 months to January 2023.
5. Property status for UK
Transactions involving the creation of a new register, such as new builds, are more complex and need more time to process. This means they can take longer to appear in the land registers. The volume of new build transactions for the most recent 2 months are not at a reliable level for reporting the breakdown between new build and existing resold property, so they are not included in the report.
New build and existing resold property
| Property status | Average price January 2023 | Monthly change | Annual change |
|---|---|---|---|
| New build | 拢389,659 | -0.9% | 11.1% |
| Existing resold property | 拢282,246 | -0.9% | 5.6% |
(CSV, 1KB)
Note: Since the October 2017 release, amendments have been made to our estimation model when calculating our provisional estimate. Find out further information and the impact of this change in the methods used to produce the UK HPI.
6. Buyer status for Great Britain
First time buyer and former owner occupier
For Great Britain only, Northern Ireland data is not available for buyer status.
| Type of buyer | Average price March 2023 | Monthly change | Annual change |
|---|---|---|---|
| First time buyer | 拢236,682 | -1.3% | 3.8% |
| Former owner occupier | 拢334,480 | -1.1% | 4.3% |
(CSV, 1KB)
7. Funding status for Great Britain
Cash and mortgage
For Great Britain only, Northern Ireland data is not available for funding status.
| Funding status | Average price March 2023 | Monthly change | Annual change |
|---|---|---|---|
| Cash | 拢269,272 | -1.1% | 3.8% |
| Mortgage | 拢297,619 | -1.2% | 4.2% |
(CSV, 1KB)
8. Housing transaction distributions
Between October and December 2022, there were 169,263 property sales.
The most popular price range for:
- England was 拢175,000 to 拢199,999 鈥� 10,780 properties were purchased
- Scotland was 拢125,000 to 拢149,999 鈥� 2,548 properties were purchased
- Wales was 拢150,000 to 拢174,999 鈥� 1187 properties were purchased
- Northern Ireland was 拢150,000 to 拢174,999 鈥� 909 properties were purchased
The charts below show the distribution of housing transactions for Q4 (October to December) 2022 for countries of the UK. Data for Great Britain is presented in bands of 拢25,000 up to 拢10 million, followed by a larger band for over 拢10 million. Data for Northern Ireland is presented in bands of 拢25,000 up to 拢500,000, followed by a larger band for over 拢500,000.
In line with the UK HPI revisions policy, the number of transactions will increase as more data are incorporated into the index, which would also impact the distributions presented in this analysis.
England housing transactions
| Price band | Housing transactions |
|---|---|
| less than 拢25,000 | 23 |
| 拢25,000 - 拢49,999 | 414 |
| 拢50,000 - 拢74,999 | 2159 |
| 拢75,000 - 拢99,999 | 5224 |
| 拢100,000 - 拢124,999 | 7034 |
| 拢125,000 - 拢149,999 | 8978 |
| 拢150,000 - 拢174,999 | 10364 |
| 拢175,000 - 拢199,999 | 10780 |
| 拢200,000 - 拢224,999 | 10310 |
| 拢225,000 - 拢249,999 | 10581 |
| 拢250,000 - 拢274,999 | 10413 |
| 拢275,000 - 拢299,999 | 9411 |
| 拢300,000 - 拢324,999 | 8374 |
| 拢325,000 - 拢349,999 | 7971 |
| 拢350,000 - 拢374,999 | 7283 |
| 拢375,000 - 拢399,999 | 6540 |
| 拢400,000 - 拢424,999 | 5781 |
| 拢425,000 - 拢449,999 | 5201 |
| 拢450,000 - 拢474,999 | 4662 |
| 拢475,000 - 拢499,999 | 4038 |
| 拢500,000 - 拢524,999 | 3251 |
| 拢525,000 - 拢549,999 | 2766 |
| 拢550,000 - 拢574,999 | 2745 |
| 拢575,000 - 拢599,999 | 2332 |
| 拢600,000 - 拢624,999 | 2189 |
| 拢625,000 - 拢649,999 | 1834 |
| 拢650,000 - 拢674,999 | 1754 |
| 拢675,000 - 拢699,999 | 1452 |
| 拢700,000 - 拢724,999 | 1292 |
| 拢725,000 - 拢749,999 | 1068 |
| 拢750,000 - 拢774,999 | 1178 |
| 拢775,000 - 拢799,999 | 875 |
| 拢800,000 - 拢824,999 | 865 |
| 拢825,000 - 拢849,999 | 769 |
| 拢850,000 - 拢874,999 | 820 |
| 拢875,000 - 拢899,999 | 642 |
| 拢900,000 - 拢924,999 | 594 |
| 拢925,000 - 拢949,999 | 436 |
| 拢950,000 - 拢974,999 | 506 |
| 拢975,000 - 拢999,999 | 387 |
| 拢1,000,000 - 拢1,249,999 | 2338 |
| 拢1,250,000 - 拢1,499,999 | 1433 |
| 拢1,500,000 - 拢1,749,999 | 762 |
| 拢1,750,000 - 拢1,999,999 | 438 |
| 拢2,000,000 - 拢4,999,999 | 885 |
| 拢5,000,000 - 拢9,999,999 | 87 |
| greater than 拢10,000,000 | 24 |
Scotland housing transactions
| Price band | Housing transactions |
|---|---|
| less than 拢25,000 | 75 |
| 拢25,000 - 拢49,999 | 611 |
| 拢50,000 - 拢74,999 | 1508 |
| 拢75,000 - 拢99,999 | 2391 |
| 拢100,000 - 拢124,999 | 2314 |
| 拢125,000 - 拢149,999 | 2548 |
| 拢150,000 - 拢174,999 | 2267 |
| 拢175,000 - 拢199,999 | 1951 |
| 拢200,000 - 拢224,999 | 1808 |
| 拢225,000 - 拢249,999 | 1732 |
| 拢250,000 - 拢274,999 | 1509 |
| 拢275,000 - 拢299,999 | 1190 |
| 拢300,000 - 拢324,999 | 1097 |
| 拢325,000 - 拢349,999 | 934 |
| 拢350,000 - 拢374,999 | 728 |
| 拢375,000 - 拢399,999 | 617 |
| 拢400,000 - 拢424,999 | 452 |
| 拢425,000 - 拢449,999 | 329 |
| 拢450,000 - 拢474,999 | 301 |
| 拢475,000 - 拢499,999 | 237 |
| 拢500,000 - 拢524,999 | 218 |
| 拢525,000 - 拢549,999 | 146 |
| 拢550,000 - 拢574,999 | 136 |
| 拢575,000 - 拢599,999 | 105 |
| 拢600,000 - 拢624,999 | 107 |
| 拢625,000 - 拢649,999 | 91 |
| 拢650,000 - 拢674,999 | 77 |
| 拢675,000 - 拢699,999 | 67 |
| 拢700,000 - 拢724,999 | 54 |
| 拢725,000 - 拢749,999 | 38 |
| 拢750,000 - 拢774,999 | 34 |
| 拢775,000 - 拢799,999 | 26 |
| 拢800,000 - 拢824,999 | 24 |
| 拢825,000 - 拢849,999 | 16 |
| 拢850,000 - 拢874,999 | 24 |
| 拢875,000 - 拢899,999 | 16 |
| 拢900,000 - 拢924,999 | 13 |
| 拢925,000 - 拢949,999 | 10 |
| 拢950,000 - 拢974,999 | 11 |
| 拢975,000 - 拢999,999 | 8 |
| 拢1,000,000 - 拢1,249,999 | 59 |
| 拢1,250,000 - 拢1,499,999 | 32 |
| 拢1,500,000 - 拢1,749,999 | 24 |
| 拢1,750,000 - 拢1,999,999 | 9 |
| 拢2,000,000 - 拢4,999,999 | 13 |
| 拢5,000,000 - 拢9,999,999 | 0 |
| greater than 拢10,000,000 | 0 |
Wales housing transactions
| Price band | Housing transactions |
|---|---|
| less than 拢25,000 | 1 |
| 拢25,000 - 拢49,999 | 27 |
| 拢50,000 - 拢74,999 | 152 |
| 拢75,000 - 拢99,999 | 495 |
| 拢100,000 - 拢124,999 | 824 |
| 拢125,000 - 拢149,999 | 1144 |
| 拢150,000 - 拢174,999 | 1187 |
| 拢175,000 - 拢199,999 | 966 |
| 拢200,000 - 拢224,999 | 720 |
| 拢225,000 - 拢249,999 | 722 |
| 拢250,000 - 拢274,999 | 611 |
| 拢275,000 - 拢299,999 | 503 |
| 拢300,000 - 拢324,999 | 407 |
| 拢325,000 - 拢349,999 | 308 |
| 拢350,000 - 拢374,999 | 299 |
| 拢375,000 - 拢399,999 | 239 |
| 拢400,000 - 拢424,999 | 190 |
| 拢425,000 - 拢449,999 | 165 |
| 拢450,000 - 拢474,999 | 117 |
| 拢475,000 - 拢499,999 | 102 |
| 拢500,000 - 拢524,999 | 74 |
| 拢525,000 - 拢549,999 | 61 |
| 拢550,000 - 拢574,999 | 69 |
| 拢575,000 - 拢599,999 | 49 |
| 拢600,000 - 拢624,999 | 35 |
| 拢625,000 - 拢649,999 | 27 |
| 拢650,000 - 拢674,999 | 29 |
| 拢675,000 - 拢699,999 | 23 |
| 拢700,000 - 拢724,999 | 27 |
| 拢725,000 - 拢749,999 | 10 |
| 拢750,000 - 拢774,999 | 18 |
| 拢775,000 - 拢799,999 | 8 |
| 拢800,000 - 拢824,999 | 7 |
| 拢825,000 - 拢849,999 | 9 |
| 拢850,000 - 拢874,999 | 7 |
| 拢875,000 - 拢899,999 | 5 |
| 拢900,000 - 拢924,999 | 6 |
| 拢925,000 - 拢949,999 | 4 |
| 拢950,000 - 拢974,999 | 9 |
| 拢975,000 - 拢999,999 | 4 |
| 拢1,000,000 - 拢1,249,999 | 18 |
| 拢1,250,000 - 拢1,499,999 | 6 |
| 拢1,500,000 - 拢1,749,999 | 6 |
| 拢1,750,000 - 拢1,999,999 | 1 |
| 拢2,000,000 - 拢4,999,999 | 0 |
| 拢5,000,000 - 拢9,999,999 | 0 |
| greater than 拢10,000,000 | 0 |
Northern Ireland housing transactions
| Price band | Housing transactions |
|---|---|
| less than 拢25,000 | 10 |
| 拢25,000 - 拢49,999 | 107 |
| 拢50,000 - 拢74,999 | 400 |
| 拢75,000 - 拢99,999 | 729 |
| 拢100,000 - 拢124,999 | 759 |
| 拢125,000 - 拢149,999 | 852 |
| 拢150,000 - 拢174,999 | 909 |
| 拢175,000 - 拢199,999 | 673 |
| 拢200,000 - 拢224,999 | 402 |
| 拢225,000 - 拢249,999 | 306 |
| 拢250,000 - 拢274,999 | 225 |
| 拢275,000 - 拢299,999 | 217 |
| 拢300,000 - 拢324,999 | 139 |
| 拢325,000 - 拢349,999 | 106 |
| 拢350,000 - 拢374,999 | 68 |
| 拢375,000 - 拢399,999 | 74 |
| 拢400,000 - 拢424,999 | 49 |
| 拢425,000 - 拢449,999 | 40 |
| 拢450,000 - 拢474,999 | 29 |
| 拢475,000 - 拢499,999 | 22 |
| greater than 拢500,000 | 134 |
9. Access the data
Download the data as CSV files or access it with .
Data revisions
View any revisions to previously published data in the data downloads or find out more about revisions in our guidance About the UK HPI.
10. About the UK House Price Index
The UK House Price Index (UK HPI) is calculated by the Office for National Statistics and Land & Property Services Northern Ireland. Find out about the methodology used to create the UK HPI.
Data for the UK House Price Index is provided by HM Land Registry, , and the Valuation Office Agency.
Find out more about the UK House Price Index.
11. Contact
Eileen Morrison, Data Services Team Leader, HM Land Registry
Email eileen.morrison@landregistry.gov.uk
Telephone 0300 006 5288
Aimee North, Head of Housing Market Indices, Office for National Statistics
Email aimee.north@ons.gov.uk
Telephone 01633 456400
Ciara Cunningham, Statistician for the Northern Ireland HPI
Email ciara.cunningham@finance-ni.gov.uk
Telephone 028 90 336035
Anne MacDonald, Land & Property Data Team, Registers of Scotland
Email Anne.MacDonald@ros.gov.uk
Telephone 0131 378 4991